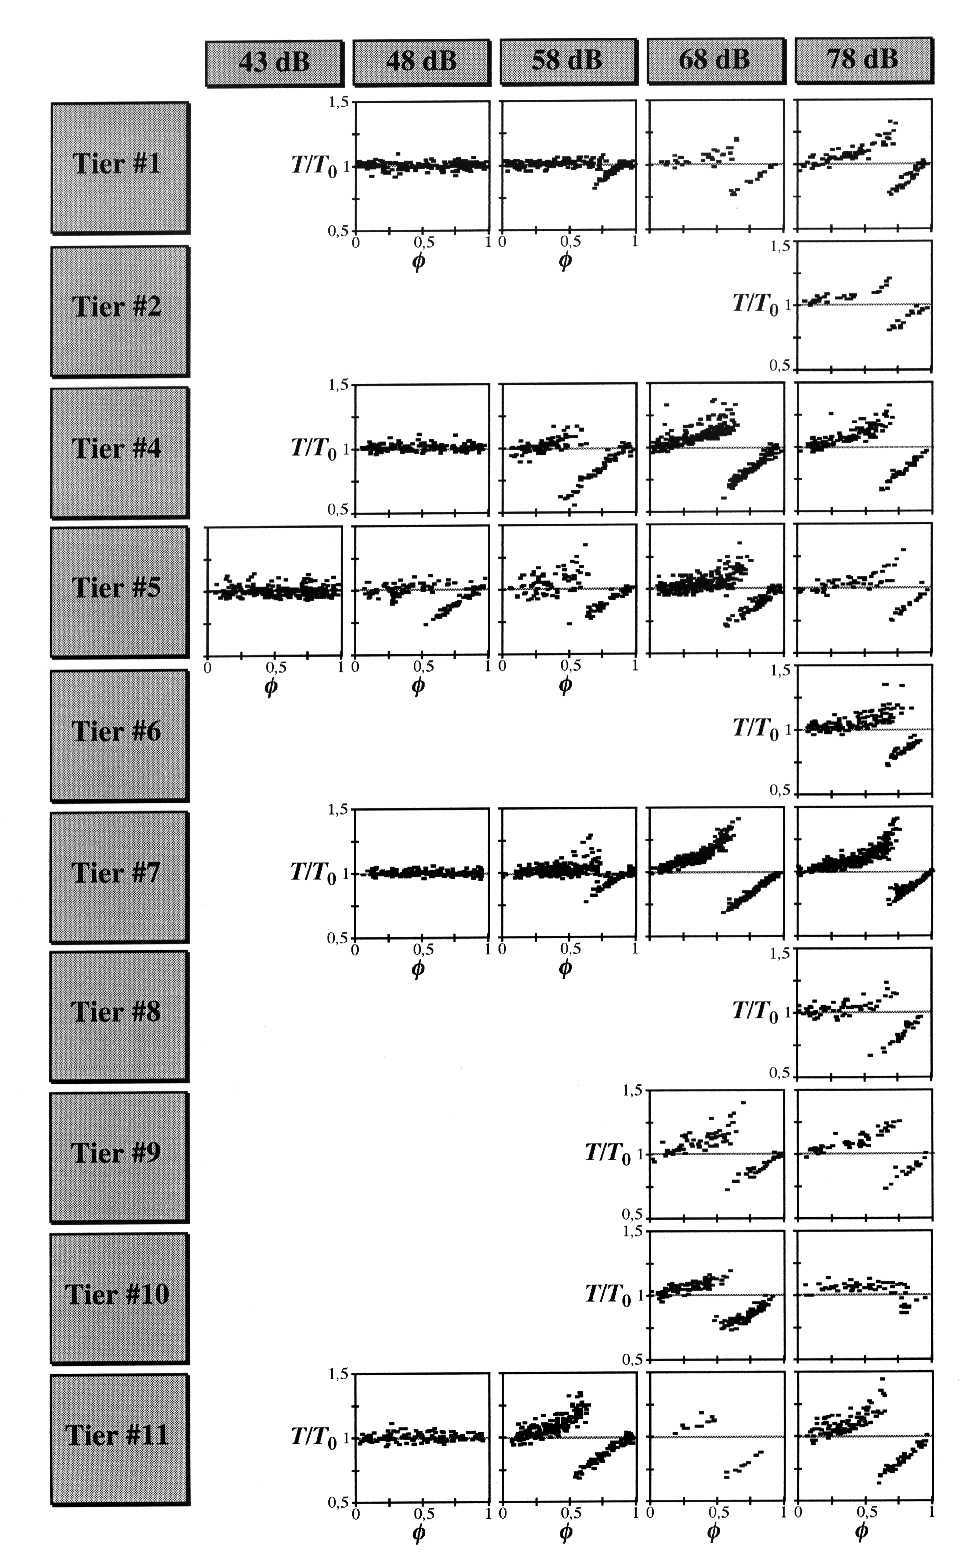
Experimentally determined phase response plots
In the following table you can see the phase response plots of 10 subjects at different stimulus' intensities. On the left there are the individuals identifers (Tier: animal in German), on the top the sound pressure level of stimulus chirps [43, 48, 58, 68, and 78 dB]. The program Kyberniidae uses PRCs fitting these data. x-axis: phase of stimulus chirp (endogenous chirp circle length normalized to one); y-axis: deviation of disturbed circle length (T0) from endogenous circle length (T).
© 1999 Klaus F. Steiner (15.7.1999)